Many people are under the misconception that mortgage financing is not available on Fire Island but that is not the case. Mortgage financing, both for second homes and investment properties on Fire Island, is available through a wide variety of lenders. Though not all banks will lend on the island, most will. No need to stockpile the entire purchase price in cash if you don’t want to.
It is important to know that there is a difference between rental homes and vacation properties and that they are financed differently. You would want to buy your beach home as a vacation home if you are able to purchase your home without needing the property to generate any income. Qualifying for a mortgage is more attainable and straightforward when rental income is off the table and you'll get a better mortgage interest in this case as well.
With Fire Island's robust rental market, buyers take advantage of the opportunity to earn additional income and will finance their home as an investment property. In this case, you'll need to provide an appraisal and comparable rental schedule to your lender, showing the property's potential income.
We've compiled a list of lenders we've worked with who will provide a mortgage to your second home/investment property.
- Darren Stuart, Vice President GuardHill Financial Corp.
NMLS# 463667
140 East 45th Street, 31st Floor
New York, NY 10017
NMLS#1609
Office:(212) 688.9500 x312
Direct:(646) 519.7682
Mobile:(212) 686.2145
E-Fax:(212) 937-3737
dstuart@guardhill.com
www.guardhill.com
- David Schindel, Silver Fin Capital LLC.
185 Great Neck Road, Suite 304
Great Neck, NY 11021
Direct: (516)203.4565
Fax: (516)323.7776
Mobile:(917)656.5172
Registered Mortgage Broker – NYS Banking Dept.
Licensed Mortgage Broker - CT, FL, NJ
NMLS ID: 149186
http://www.silverfincapital.com/david-schindel.html
Many people spend their lives dreaming of owning a beach house, but instead of going for it, they assume it's a luxury that's out of reach. However, with Fire Island’s robust rental market, you might be surprised at the financial realities of owning a vacation home. Buying a beach house can give you the opportunity to earn significant income by renting out the home when you're not using it. Most of the buyers we service see their purchases as both an asset they can enjoy with their family and friends, and as an investment that can produce rental income to defray the cost of ownership. Renting the home frequently gives the owner the opportunity to own the home at a substantially subsidized cost, with some properties actually carrying themselves. Additionally, many people are under the misconception that mortgage financing is not available on Fire Island but that is not the case. Mortgage financing, both for second homes and investment properties on Fire Island, is available through a wide variety of lenders. No need to stockpile the entire purchase price in cash if you don't want to.
Wondering what renting your beach house could look like for you? On Fire Island, weekly rentals range anywhere from $2,500-$16,000 per week depending on the property. Owners who don't block out any time for their personal use frequently earn approximately 12 times their peak weekly rate as an annual total. For example, if your home rents for $5,000/week in July & August, you could expect to earn approximately $60,000/year in gross rentals for your home. If you decided to use it for 2 peak summer weeks, then you can adjust your expected gross rental by $10,000.
While there is an active market for rentals from May to October, you'll see the highest rents during the peak summer weeks, which corresponds to when kids are out of school, since that is when most families take their vacations. Shoulder season rents are typically about half what a home commands during July & August. Many homeowners choose to use their homes more during the shoulder seasons, (preferring the peace, quiet and lack of crowds) and rent them out during the peak for maximum rental income. While renting out their home the majority of the time is a great option for buyers looking at their home primarily as an investment, for those who prefer to use the home for the majority of the summer season, in many cases, renting just one or two summer weeks will cover your annual taxes and insurance. Even if your primary objective is to purchase a home for your personal use, it's nice to know that the asset you're purchasing has the potential to generate significant income, just in case your circumstances might change in the future.
Some buyers love the idea of owning a vacation rental, but don't have the necessary time to devote to it. Full service rental management is available to handle all of the hassle for you, so you can still use the home when you want, and generate income when you want, all without any effort on your part. At the end of the day, owning a vacation rental gives you the best of both worlds- income and personal enjoyment!
Wondering what to get for your favorite Fire Islander this year for the holidays? Read on for our Fire Island Gift Guide! We've put together the best ideas for beach gear, decor, and Fire Island related items for the person who just can't get enough of the Fire Island life.

- Radio Flyer Classic Tricycle - Perfect for the kids! Bring this tricycle to your next Fire Island getaway for the kids to ride around!

- Dune Jewelry - The ultimate gift for a Fire Island lover. Dune jewelry is handcrafted with sand and natural elements from your favorite beach! Choose sand from Ocean Beach, Kismet, Atlantique, Davis Park, Dunewood, Fair Harbor, Fire Island Pines, and more! From bracelets to rings to necklaces, you'll be sure to find the perfect piece for the beach lover in your life.

- Fire Island Modernist - Is your Fire Islander an architecture buff? The Fire Island Modernist ponders a fascinating era through an overlooked architect, Horace Gifford, executed a remarkable series of beach houses that transformed the terrain and culture of New York’s Fire Island.

- Willy Nilly Trading Company - If you haven't stopped in Willy Nilly on Main Street in Bay Shore then you are missing out on all things Long Island! This one stop shop has a ton of beach house decor, Long Island related items, and even Dune Jewelry that we mentioned above! With plenty of Fire Island signs, paintings, and household items, it'll be hard to stop yourself from walking about with the whole store!

- Yeti Beach Coolers - The Mother of all beach coolers. Yeti has changed the game when it comes to keeping your beach refreshments cold. For up to 10 hours, your refreshments will stay just as cool as when you left for your fun-filled beach day. Most of their products have a No Sweat Design, meaning you'll never be stuck mopping up a mess. Gone are the days where you'll have to worry about keeping those beach brews cold all day!

- Great South Bay Candle Company - Take the ocean home with you! This candle will fill your home with a clean and refreshing scent just like the Fire Island ocean breeze.

- Josh Goetz Photography - Looking for some wall art? Josh Goetz Photography features prints from all over Fire Island and Long Island's south shore. These gorgeous photos are the perfect addition to your home!

- The Lost Dog Art & Frame Co. - The original hand drawn typography maps and illustrations. This brand has plenty of Fire Island related items that will be sure to add some character to your beach house!

- Fire Island Decorative Pillows - Who doesn't love to cuddle with a comfy pillow after a long day? These throw pillows add the perfect Fire Island touch to your home. We love these too! Fire Island Gold Sand Pillow. Fire Island Pillow from Beach Decor Shop

- Ooh La La Boutiques - There's nothing more stylish than shopping local. Ooh La La has a location in Ocean Beach as well as Babylon, Sayville, and Long Beach.

- Beach Koozies - The perfect stocking stuffer!

- Tommy Bahama Beach Chair w/ Cooler - The perfect beach accessory. Not only are these beach chairs comfortable with its head rest but the little cooler in the back is just another spot where you can store your beach essentials! Go hands free and wear it as a backpack!

- The Islander Wagon - This wagon is perfect for carrying large loads of groceries and other goods from the ferry.

- SixThreeZero Beach Cruiser Bikes - Biking will be your favorite way to get around when you have one of these cruisers!

- Kayak - Kayaking is a fun beach activity for everyone! Kayak around the beautiful Great South Bay and when you're done for the day you can even store it at a spot in Ocean Bay Park! Look for the Kayak Racks on Bayview Walk!

- Bulk Ferry Tickets - Buying ferry tickets in bulk is probably the most convenient gift for your Fire Islander. It will save lots of time when your running to make that ferry!

- BEACH HOUSE! - The ULTIMATE Fire Island gift! Finding the perfect beach house for the Fire Island lover in your life will definitely have you winning Christmas this year and possibly staying at the top of the Nice List! Check out what's for sale!
Now that we’re into November and you’ve probably gotten every last bit of use out of your beach house, it’s time to think about how to safely close your home for the winter. We’ve put together a checklist to help walk you through the big jobs and the often-overlooked details to ensure your home stays in great shape until next year.
- As the weather is getting colder, you’ve probably already had your last weekend at your beach house. It's important to have the water drained from your home before temperatures dip below freezing. It's best to give your plumber plenty of notice to ensure they're able to drain your house in time. If you’re delaying closing up for the season thinking you could possibly get one more weekend in at your home, this leaves the door open to a mad rush for the plumbers when word comes of the first freeze of the season, so plan accordingly.
- Bring your bikes, wagon, and BBQ inside for the winter to prolong their lifespan. Many homeowners lay down a large tarp to protect their floors and then move the majority of their outdoor furniture inside to protect it for the winter.
- Leave nothing in the house that can attract pests. This includes all foods including cereal, sugar, breads, crackers, and even birdseed. Soaps and shampoos should also be removed from the premises, or at a minimum, tightly secured in a plastic bin with strong latches.
- It's best to remove your canned food, bottled water, soda, wine and beer, as it will freeze and could burst its container. Liquors with high alcohol content will not freeze, so are okay to store.
- Most cleaners and powders can be left under the kitchen sink.
- Some utility providers will allow you to suspend services for the winter months. Do not have PSEG turn off your electric until your plumber has finished draining your home. Your electric needs to be on in order for the plumber to run their pumps. You can just turn off the main electric breaker for the winter rather than turning off your account, however you'll still be charged a small monthly minimum service fee.
- Make sure that your chimney has a cap to prevent animals from getting into your house. During the cold winter months, animals will seek shelter wherever they can find it, so it is important to make sure that all openings to your home are secure.
- Make sure not to block access to your water heaters and washing machines, whether they're located inside your house or in your shed. You’ll need to have them drained so there should be access to them.
- If you bag up your linens for the off season, put a few dryer sheets in the bags to absorb any residual moisture and keep them smelling fresh.
Even though most residents depart for the winter months, we're here year round for all of your real estate needs. If you find yourself in Ocean Beach stop in and say hello! Even if you can't make it here, you can keep up with the local goings on about town on our facebook and instagram.
By: Abigail Mago, Licensed Associate Broker
abigail@fireislandrealestate.com
A very common question that I'm asked by buyers is "When is the best time to buy on Fire Island?" Many people assume that the Summer is the peak of the buying season, because that is when the island is busiest, but that's not actually the case. Most serious buyers actually do their shopping during the Fall or Spring months. The best time to buy depends a lot on what your plan is for the home. If you're buying a property and planning to renovate, or are purchasing a rental investment, your best bet is likely to purchase in the Fall. If you're looking for a turnkey home for your personal use, then buying in the Spring is likely ideal timing. There is also an argument to be made for shopping during the dead of winter, when sellers are likely seeing the least showing activity on their properties. Buyers utilizing bank financing should also take the extended timeline required for mortgage processing into consideration.
Whether it's light cosmetic updates to transform a house into a home, or a major structural overhaul, we find that a large proportion of buyers purchase with the intention of renovating. If this is the case, you’ll want to purchase early in the fall to allow yourself enough time to make your desired improvements so your home will be ready to be enjoyed for the Summer season! If your project is more substantial and requires architectural drawings and building permits, it could take several months just for the design and permitting process, so make sure to factor that into your timeline.
If you’re looking to purchase an investment property on Fire Island, you might be tempted to wait until the Spring to close so as to avoid the cost of carrying the house through the Winter months, however that timing might not be ideal, even if the home you're buying doesn't need any work. As a vacation rental homeowner on Fire Island, even though your guests likely won't start staying with you until the Spring and Summer seasons, the booking season actually occurs primarily over the winter months, so closing in the fall is beneficial to allow time for the property to be marketed and booked up in advance of the season. If you wait until the Spring to purchase your investment property, you may run into another complicating factor with respect to properties that already have bookings for the upcoming season. In that case, the rent is prorated in accordance with the date of the closing, providing a large incentive for the seller to push the closing out as far as possible, and a large opposing incentive for the buyer to close as quickly as possible. For example, if the home has $100k of rental income booked for stays between June 1st– Sept. 1st, if the closing occurs in May, the buyer would be entitled to keep all of the rental income. If the closing occurs halfway through the rental period, the buyer would only get to keep half of the rental income ($50k in this example) and if the closing were to occur in September after the rental period, the buyer wouldn't get any of the rental income and the seller would keep the full $100k. If you're shopping in the spring, the seller of a rental property is definitely going to take that into account, so you would likely find yourself in a more favorable negotiating position in the Fall. While you would have to pay for the carrying cost of the house during the winter months, you would still have money coming in over that period, because rent is customarily paid in advance on Fire Island, with a substantial deposit being put down at the time of booking.
If you're lucky enough to find your dream turnkey beach house, in that case the best time to buy is likely in the Spring, so you can move right in and start enjoying! This way you also avoid carrying the cost of the house all winter while you probably won’t be using the home. Make sure you plan for enough time for your mortgage to be processed if you’re purchasing with financing, as many buyers underestimate how long it can take. The fastest mortgage I've ever seen was done in 30 days, but it is much more common for mortgage deals to take up 90 days, particularly with the bigger banks which tend to be slower to get things done.
Many buyers ask what time of year sellers tend to be the most negotiable. Every individual's situation is different, but many sellers will be more eager to sell in the Fall after the close of the season rather than the Spring, when they've just endured a cold Winter and it feels like Summer is just around the corner and they may be eager to enjoy one last Summer at the beach. Additionally, there’s less buyer activity in the dead of Winter so if you choose to look then, you'll have less competition from other buyers and the seller may be more receptive to your offer at that time.
All that being said, I counsel my clients that the time to buy has less to do with the season and more to do with when the right property for you becomes available. Fire Island is a small market with a relatively limited supply, so if a property comes on that meets your criteria, it's usually wise to jump on it. This is particularly true if you are looking for something very specific in terms of location or amenities. If you only want to be in a specific area or if you want to purchase something rarely available like bayfront, oceanfront, a home with a pool, 5+ bedrooms, or an oversized piece of property, and nothing appropriate is available during your initial search, you're best off monitoring the inventory on a regular basis so you won't miss out when the dream house pops up. Be sure to follow us on facebook and instagram for real time listing updates. If you have any more questions about purchasing a home on Fire Island, please feel free to reach out to us. We look forward to the opportunity to be of service to you!
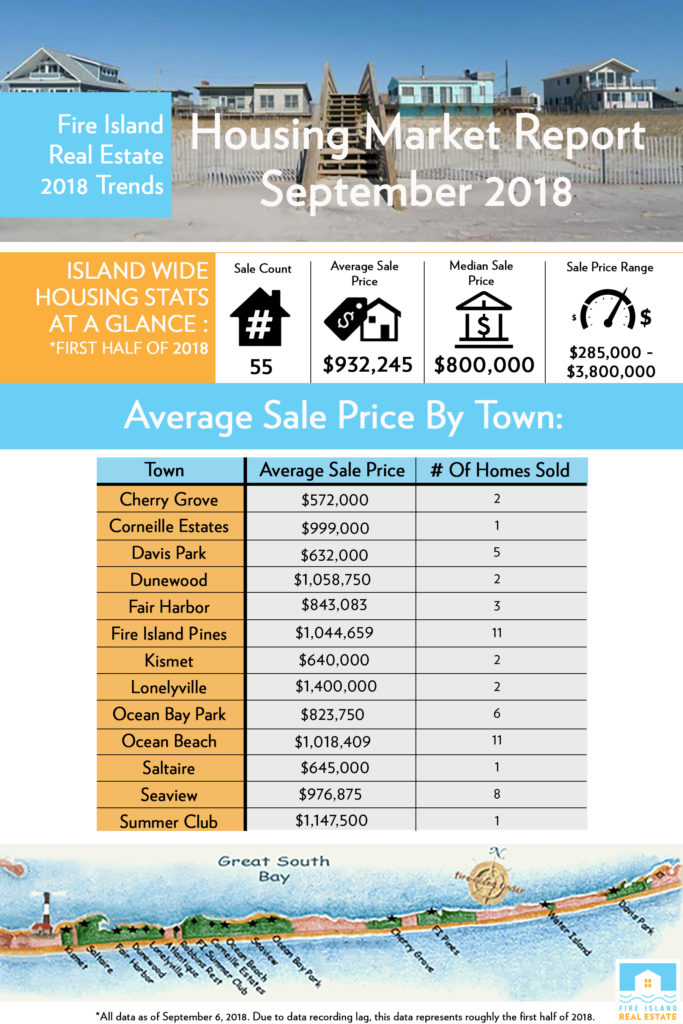
Fire Island Real Estate has gathered data on the Fire Island housing market so far in 2018. Check out our infographic below for Fire Island wide housing stats.
In this article, The Wall Street Journal covers wealthy buyers' interest in real estate on Fire Island. Fire Island Real Estate's Licensed Associate Broker, Abigail Mago, gives insight on how Hurricane Sandy drove up prices in the long term and why buyers are drawn to Fire Island. Check out the article below!
abigail@fireislandrealestate.com
So far, things have been looking up for the Fire Island real estate market in 2018. There have been 30 sales transactions recorded island wide, year to date. Because there is a recording lag of up to 90 days for sale data to come through to public sale record, this data consists mainly of sales that closed during the first quarter of 2018. At 30 transactions closed year to date, that puts transaction volume on pace for approximately 120 sales this year. In an average year, Fire Island sees 99 homes sell, indicating that the strong market we've been experiencing over the past few years appears to be continuing into 2018.
The average Fire Island year to date sale price is $925,853, which is up 16% from 2017's average sale price of $797,947. The median sale price is $804,250, which is up 6% from 2017's median price of $760,000. The high end of the market has been performing much better in 2018 than it did in 2017. While the overall market was strong in 2017, the high end of the market was unusually inactive, with no homes trading over the $2 million mark. 2018 is already ahead of last year, with the highest price paid for a home so far coming in at $2,390,000, which is nearly 30% higher than 2017's high price paid of $1,850,000.
Curious as to how the market is performing in your town? See the table below for a town by town breakdown of the year to date 2018 average sale price as compared to 2017.

The 2018 summer season is fast approaching, and we wanted to inform you of an exciting improvements made by the Fire Island Ferries freight department! To increase ease and convenience, they have started accepting credit cards for freight!
The Fire Island Ferries' new system eliminates the need to carry cash to either drop-off or pick-up freight. The new website allows new residential customers to create a user-friendly, secure account where they can put in their billing information and they'll be billed automatically during the season. Additionally, it allows residents to view their shipments at any time of day and for any shipping period from the current day to the current season.
For existing residential customers, if you have been shipping with the freight department in the past, then your name and address is probably already on file in their system. The freight department encourages existing residential customers to call or email them to confirm your information is already in the system.
Commercial accounts for invoiced customers only are free to utilize the website to track shipments but cannot create a new commercial account. Invoiced customers' billing is done separately and do not need to enter any credit card information on the website.
You can access the freight information here: http://www.fireislandferries.com/freight-info/ and you can access the Fire Island Ferries Freight Portal, where you can create your account, here: https://fireislandfreight.azurewebsites.net
You can contact the freight department at 631-647-3055 or at freight@fireislandferries.com with any questions.

Prepared By: Abigail Medvin Mago, Licensed Associate Broker
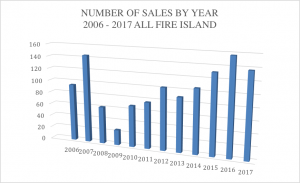
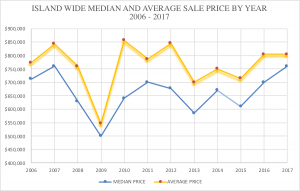
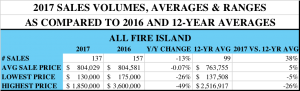
Overall the Fire Island real estate market saw another strong year in 2017. A typical year sees 99 transactions per year[1], but in 2017, 137 Fire Island homes were sold. While that does represent a 13% year over year decline from 2016’s very brisk volume of 157 sales, when put into historical context, 2017 transaction volume was 38% greater than an average year. Additionally, we may see a few more 2017 sales come through recording, which should bring the year over year sales volume numbers closer to parity.
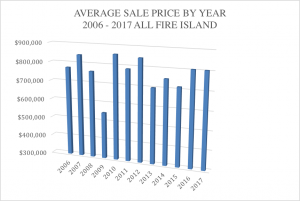
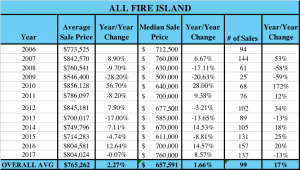
The average sale price stayed essentially flat year over year, from $804,581 in 2016 to $804,024 in 2017. To put the average sale price in historical context, the 2017 island-wide average sale price of $804,029 is 5% above the 12-year average of $763,755. (I began collecting data in 2006, so all historic averages refer to 2006 through 2017.)
The highest price paid for a home on the island in 2017 was $1,850,000, which is nearly 50% lower than the highest price paid for a Fire Island home in 2016, which was $3,600,000. It is also 26% lower than the 12-year average of the highest price paid in a given year since 2006, which is $2,516,917. The only year since I began collecting data where the highest price paid for a home in that year was lower than 2017 was in 2009, where the highest price paid topped out at $1,200,000. The lack of activity at the very top end of the market is somewhat unusual, however does not seem to be symptomatic of performance in the rest of the market.
Because of the relatively small size of the Fire Island market, when we see transactions in the 2 and 3 million dollar range, it can skew the overall averages upward fairly significantly, so the fact that the average sale price remained essentially the same year over year even though there were no high value sales (defined as $2 million and over) shows that price performance in 2017 was actually stronger than the average sale price would indicate. In fact, when we look at the median sale prices, 2017 outperformed 2016 by 8%, with a median sale price of $760,000 as compared to 2016’s median price of $700,000. Although the very high-end of the market saw little activity, this indicates strong market performance in the middle and lower segments of the market. Because the median is not skewed by outliers as the average is, it can be a more accurate measure of market performance. The 2017 median sale price of $760,000 is (tied with 2007) the highest median sale price seen during the data collection period. Evidence of this trend is also seen in the fact that several communities saw a drastic rise in price point for the lowest price sale of the year, indicating that inventory at the lowest segment of the market has largely cleared.
To put the 2017 market data into perspective, it is helpful to look at sales figures relative to the entire period of data collection in addition to comparing to the previous year’s performance.
Town by Town Analysis
In addition to looking at the island’s overall market performance, it is useful to examine the data on a town by town basis.
ATLANTIQUE
Atlantique saw no sales activity in 2017. A small community, Atlantique usually sees 1 sale per year. The average sale price over the past 12 years in Atlantique is $589,323.

CHERRY GROVE
Cherry Grove had another solid year in 2017, with 10 homes trading, as compared to 11 homes in 2016 and a historical average of 8 per year. The average sale price in 2017 was $545,600, which was up 6% from $516,550 in 2016, and up 1% from the 12-year average sale price of $538,447. The least expensive Cherry Grove property to trade in 2017 was $260,000, up 49% from 2016’s lowest price of $175,000.

CORNEILLE ESTATES
Two homes sold in Corneille Estates in 2017, as compared to 4 homes in 2016. Even though the number of sales declined by 50% year over year, 2 sales per year is average for the community. The 2017 average sale price was $840,000 which is 27% higher than 2016’s average sale price and 21% higher than the last 12 year’s average sale price of $697,087. 2017’s lowest price Corneille Estates sale of $820,000 was more than double 2016’s lowest price sale of $400,000. The highest price paid for a Corneille Estates home in 2017 was $860,000, up 13% from 2016’s high price of $762,500 and up 17% from the 12-year average high price of $732,955.

DAVIS PARK
Sales transaction volume in Davis Park doubled in 2017, going from four sales in 2016 to 8 sales in 2017. The average sale price rose by 10% from $521,250 in 2016 to $571,529 in 2017, and was 12% higher than an average year. The highest price paid for a home in Davis Park in 2017 was $875,000 which was a 37% increase over the previous year, and 21% higher than the average highest price paid in the last 12 years.

DUNEWOOD
No homes sold in Dunewood in 2017. A small community, Dunewood typically sees only one home sale per year. In the last 12 years, the average sale price in Dunewood was $742,452.

FAIR HARBOR
Fair Harbor had a very strong year with 13 sales in 2017, representing a 30% year over year increase in sales volume and a 63% increase over the 12-year average of 8 sales per year. The average sale price was also up 19% year over year, to $801,148 in 2017 from $671,148 in 2016. This is a 22% increase over the historical average sale price of $658,840. The highest price paid in Fair Harbor in 2017 was $1,760,000, which is 83% higher than the highest price paid in 2016 and 69% higher than the highest price paid in an average year. The lowest price paid in Fair Harbor in 2017 of $550,000 is 80% higher than the lowest price paid in Fair Harbor in 2016 of $304,979.

FIRE ISLAND PINES
The Pines market remained remarkably steady from 2016 to 2017, with 27 homes trading hands in both years and the average sale price remaining with a quarter percentage point, year over year. The average 2017 sale price was $1,001,569, which is less than 1% shy of the 12-year average sale price of $1,008,788. Like the similarly priced communities of Seaview and Saltaire, the Pines saw a similar trend in the highest price paid for the year being much less than the 12-year historical average. The highest price paid in the Pines in 2017 was $1,850,000, down 40% from 2016’s high price of $3,070,000 and off 18% from the 12-year average sale price of $2,242,458. The lowest price paid in the Pines in 2017 was $550,000, which is 57% higher than the lowest price paid in 2016 of $350,000.
Interestingly, we see the exact same data pattern as Seaview and Saltaire, when looking at the median price points. Even though the average sale prices saw almost no change, the median sale price increased by 9.5% from $840,000 in 2016 to $920,000 in 2017. This in combination with the lack of high end sales, indicate the market was driven by strength in the middle segment, whereas 2016’s market performance was buoyed by a handful of high priced sales.

KISMET
Kismet saw solid price growth, with an 8% year over year increase in average sale price. While the number of sales declined from 7 in 2016 to 6 sales in 2017, that still represents a sales volume of 20% greater than an average year. The average sale price increased from $636,429 in 2016 to $685,667 in 2017. The lowest price paid for a Kismet home was 9% lower in 2017 than in 2016, but was 19% higher than in an average year. The highest price paid in Kismet in 2017 was $885,000 which was 4% higher than 2016’s high price paid of $850,000.

OCEAN BAY PARK
2017 saw 9 home sales in Ocean Bay Park at an average sale price of $640,611. In comparison, 2016 saw 16 Ocean Bay Park home sales at an average sale price of $780,688. However, comparing these measures year over year is misleading, due to the fact that several condemnation sales of oceanfront homes took place in 2016 in order to facilitate the dune restoration project that will be completed this year. Owners of the condemned oceanfront properties were paid market value for their homes by the county, resulting in an upward skewing of the 2016 sales data since the proportion of oceanfront homes (which naturally command a large premium relative to inland properties) sold in 2016 was so much greater than in a typical year. 2017’s average sale price was down 18% from 2016’s average sale price of $780,688, but when the oceanfront condemnation sales are excluded, 2016’s average sale price was actually only $618,000, indicating that the year over year average sale price actually increased by 4%, and was 26% higher than the 12-year average Ocean Bay Park sale price of $509,255. Ocean Bay Park continues to gain desirability as former share houses are being bought up and converted into luxury family homes or high-end rentals.


OCEAN BEACH
The lion’s share of the island’s 137 sales took place in Ocean Beach, with 38 homes changing hands in 2017. That represents a 16% decline from Ocean Beach transaction volume in 2016 which was extraordinarily high at 45 homes. Since 2006, the village has seen 21 homes sell per year on average, so even though year over year volume was down, 2017 saw 81% more Ocean Beach home sales than a typical year.
As one might expect in light of the continued strong pace of sales, Ocean Beach sale prices were also up in 2017. The average Ocean Beach sale price in 2017 was $794,724 which is a 23% increase over the 2016 average sale price of $648,477 and 19% above the 12-year average Ocean Beach sale price, which is $665,913. The highest price paid for a home in Ocean Beach in 2017 was $1,606,000, which is 2% less than 2016’s high price of $1,646,250. The lowest price paid for an Ocean Beach home in 2017 was $400,000, up 92% from 2016’s low price of $208,133.

ROBBINS REST
Three homes sold in Robbins Rest in 2017, as compared to 2 sales in 2016. A typical year sees only one home trade in this small community, so 3 sales is a high volume year. While the volume of transactions increased, the average sale price was down considerably from $1,150,000 in 2016 to only $500,000 in 2017. This represents a 57% year over year decline in average sale price and a 34% decline from the 12-year average sale price of $756,854, however two of the three sales were of vacant parcels, thus explaining the lower price point.

SALTAIRE
Saltaire had a surprisingly lackluster year in 2017. Sales volume was down 40% from 15 sales in 2016 to only 9 sales in 2017. While the year over year transaction volume decline was steep, when compared to the 12-year average volume of 10 sales per year, 9 sales per year is not atypical. The average sale price was also down year over year, from $1,326,582 in 2016 to $1,027,011, however the 2017 average sale price was still 8% higher than the 12-year average. Interestingly, the highest price paid in Saltaire in 2017 was $1,460,000, nearly 60% less than 2016’s highest price paid of $3,600,0000. In a typical year, the highest price paid in Saltaire is $1,963,182, which is 26% higher than 2017’s highest sale. The lack of high end sales mimics the data observed in Seaview, and the Fire Island Pines which typically trade at a similar price point to Saltaire. When looking at the median price point data, we still see a price decline, but a much smaller one. The median sale price in Saltaire in 2016 was $1,075,000, as compared to $1,020,000 in 2017, a decline of just half a percent.

SEAVIEW
Seaview is traditionally considered one of the most desirable communities on Fire Island, but the past two years have seen a significant slump in sales. Only 8 Seaview homes traded hands in 2017, as compared to 12 in 2016 which represents a 33% decline in year over year sales transaction volume. However, when comparing to the past 12-year average of 9 sales per year, 8 Seaview home sales in a given year is not atypical.
The average sale price was nearly flat, year over year. The average 2017 sale price was $838,581, as compared to 2016’s average of $839,250, both off 19% from Seaview’s 12-year average sale price of $1,032,550. The most expensive home sale in Seaview in 2017 was $962,500 which is less than half the price of the most expensive home sold in an average year, which is typically close to the $2 million mark. It is rare to see a year where nothing in Seaview trades above the $2 million mark, let alone the $1 million mark. The lowest price Seaview home sold in 2017 was $660,00, which was 26% higher than 2016’s lowest price Seaview sale of $525,000. While the average sale price declined by less than 1%, the median sale price increased by 15% from $750,000 in 2016 to $863,000 in 2017.
It’s unclear why the Seaview market has been underperforming for the past couple of years. Given the small data set, I am inclined to think the lackluster sales figures don’t truly reflect a real drop in value but are driven by the fact that none of Seaview’s high value homes happened to have traded in the past 2 years. Due to its convenient location between Ocean Beach and Ocean Bay Park and considerable community amenities, Seaview remains in high demand among buyers, but quality inventory has been limited. We’ll see if 2018 sees a return to typical price levels in the community.

SUMMER CLUB
No homes traded in the Summer Club in 2017. Given that the community is comprised of only 40 homes, that’s not terribly surprising, but a typical year does see 1.5 homes in the community trade. The 12-year average sale price in the Summer Club is $719,907. With several high-end homes currently for sale in the Summer Club, I believe 2018 will see at least a few trades in the Summer Club, likely at significantly higher price levels.

WATER ISLAND
Only one home sold in Water Island in 2017, for a sale price of $1,200,000. 2016 also saw only one home sale in Water Island, but at a higher price point of $1,55,000. While the year over year average price was 23% lower in 2017, it’s still 3% above the 12-year average sale price of $1,160,046.

Conclusion
The strong Fire Island real estate market performance observed in 2016 continued into 2017, however was driven mainly by the middle and lower segments of the market. The top segment of the market (defined as $2 million and up) was completely dormant in 2017, while a typical year sees at least a handful of transactions upwards of the $2 and $3 million dollar price points. Despite this lack of activity at the high end, median sale prices were up and average sale prices remained stable, year over year. Cherry Grove, Corneille Estates, Fair Harbor, Fire Island Pines, Ocean Beach, and Seaview all saw drastic increases in their lowest price sale, year over year, indicating that inventory at the bottom end of the market has cleared.
Because the Fire Island real estate market does not function like a traditional real estate market with a centralized multiple listing service, reliable market data is not readily available to the public. Our annual market reports are published in an effort to address that. Both buyers and sellers are served by being fully informed about the market in which they are considering transacting. Please do not hesitate to contact me at abigail@fireislandrealestate.com if I can provide any further information, or if I can be of help to you in the sale or purchase of your Fire Island home.
Methodology
Please note that all information herein is deemed reliable but not guaranteed. The information is sourced from public real estate transaction records. Sales data reporting has a lag of approximately 90 days. Due to this lag, there may be some outstanding sales that closed late in 2017 but have not yet been reported and are therefore not reflected in this report.
[1] From 2006 – 2017, the average number of transactions per year has been 99.
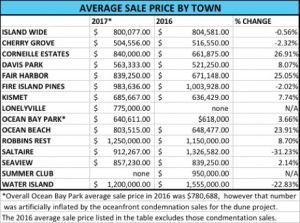
2017 was another strong year in the Fire Island real estate market. The island wide average recorded sale price as of December 22nd was $800,077, which is nearly even with 2016’s average sale price of $804,581. Several Fire Island towns saw huge year over year price growth, including Ocean Beach, where prices increased 24%, Corneille Estates, which saw a year over year increase of 27%, and Fair Harbor which saw a 25% increase in average sale price. Ocean Bay Park and Seaview saw more modest price growth at 4% and 2%, respectively. See the table below for average sale prices by town. Please note that there is a data recording lag of up to 90 days, so not all 2017 transactions have been recorded yet. The figures below represent all reported data as of December 22, 2017. We will issue a comprehensive market report in the first quarter of 2018 that will have complete 2017 sales data.
The Fire Island real estate market is still going strong. Our firm is on pace for another record year in 2017 and we want to thank all of our wonderful clients! We believe in the importance of a data driven approach and we know reliable market data can be hard to come by on Fire Island. Our annual Market Report will come out after year end, but in the meantime, we wanted to provide you with some year to date average sale data to tide you over.
Below are average recorded sale prices so far this year, by community:
Ocean Beach $770,130
Seaview $915,000
Ocean Bay Park $622,438
Robbins Rest $1,250,000
Corneille Estates $840,000
Lonelyville $775,000
Kismet $708,800
Cherry Grove $479,000
Davis Park $705,000
Fair Harbor $743,750
Fire Island Pines $877,143
Saltaire $897,657
Water Island $1,200,000
Please note that there is a lag between the time when sales actually close, are recorded in public records, and then become available to us through our data service, so there may be some closed sales not yet factored in to the above statistics.