Prepared By: Abigail Medvin Mago, Licensed Associate Broker
February 28, 2020
ISLAND WIDE DATA
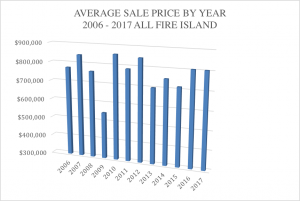
Coming off of 2018’s record performance in terms of average and median sale prices, the 2019 Fire Island real estate market saw a moderate slow down. While the island wide average and median sale prices decreased year over year, transaction volume was up 6% year over year, suggesting continued market strength despite the average and median price declines. The average sale price island wide declined from 2018’s all-time high of $907,042 to $804,441 in 2019, representing an 11% year over year decline. To provide some historical context, the average sale price over the last 14 years has been $778,050, which is 3% lower than 2019’s average.

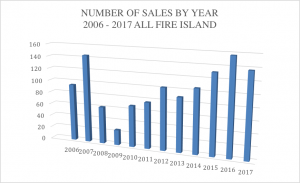
While the average sale price did decrease from 2018 to 2019, the number of homes sold increased by 9%. 145 Fire Island homes were sold in 2019, as compared to 133 in 2018. Over the last 14 years, on average 105 homes have changed hands in a given year. With 145 transactions in 2019, that represents transaction volume of 38% greater than average. Since I began data collection in 2006, only 2016 and 2017 saw a larger number of transactions than 2019, with 157 and 147 sales taking place, respectively.

The lowest priced Fire Island property sold in 2019 was $150,000, as compared to 2018’s lowest priced sale of $100,000. The most expensive property sold in 2019 traded for $2,200,000, which is 42% lower than the most expensive sale closed in 2018 of $3,800,000, and 15% lower than the 14-year average high price paid of $2,596,643. While it should be noted that 2018’s $3,800,000 sale was of a commercial property, not a residence, the high end of the market was significantly less active in 2019 than is commonly seen, with only 6 sales occurring above the $1.5M mark, and only 2 of which breaking the $2M mark. By comparison, in 2018 15 sales occurring at or above the $1.5 million mark and 7 sales occurring at or above the $2 million mark.

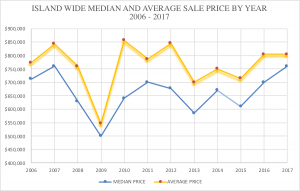
An additional indicator of stronger market activity in the middle segment rather than the high end can be seen when comparing the average and median sales prices. The median sale price in 2019 was $750,000, a 2% year over year decrease from 2018’s median sale price of $765,000. 2019’s average sale price was 7% higher than its median sale price, while 2018’s average sale price was 16% higher than its median sale price. In 2017, a year which also saw unusually little activity at the high end of the market, the average sale price was only 6% higher than the median sale price. The higher the average sale price relative to the median sale price, the greater the activity at the high end of the market, causing the average to skew upwards. The graph below compares the average and median sale prices from 2016 – 2019.

To put the 2019 market data into perspective, it is helpful to look at sales figures relative to the entire period of data collection in addition to comparing to the previous year’s performance.

PRICE SEGMENT ANALYSIS
The 2019 market was largely driven by the middle segment of the market, with more than a third of the year’s total sales occurring in the $750,000 - $1,000,000 price bracket. Because the total market size is relatively small, outlier high end sales can have a relatively large influence on the average sale prices, making the average metric not the best indicator of market performance. When breaking down each year’s sales into price segments, some interesting trends can be observed. The chart below shows sale count by year, broken down by $500,000 sale price increments.

The proportion of home sales under $500,000 has been steadily decreasing since 2013 when it topped out at 42% after Hurricane Sandy. In 2019, only 12% of homes sold at a price below $500,0000. Since 2006, the under $500k price segment has represented, on average, 24% of sales. The vast majority of 2019 home sales fell in the $500,000 - $1 million price segment, representing 72% of sales, as compared to 62% in 2018 and an average proportion of 58%. 12% of homes sold were between $1 million and $1.5 million, which was the same in 2018, and slightly above the average proportion of 11% of sales. 3% of 2019 sales were between $1.5M and $2M, which is just under the typical average of 4%. Only 1% of sales were in the $2M - $2.5M price segment, whereas typically 2% of sales fall into that segment.
TOWN BY TOWN ANALYSIS
In addition to looking at the island’s overall market performance, it is useful to examine the data on a town by town basis.
ATLANTIQUE
Atlantique saw no sales activity in 2019. A small community, Atlantique usually sees 1 sale per year. The average sale price over the past 12 years in Atlantique is $589,323.

CHERRY GROVE
Cherry Grove saw weaker market performance in 2019, with 10 homes trading, as compared to 16 homes in 2018 and a historical average of 13 per year. The average Cherry Grove sale price in 2019 was $485,000, which was down 23% from $628,933 in 2018, and down 9% from the 13-year average sale price of $535,573. The least expensive Cherry Grove property to trade in 2019 was $150,000, down 55% from 2018’s lowest price of $335,000.

CORNEILLE ESTATES
Corneille Estates saw a dramatic increase in activity in 2019, with 5 homes trading, whereas 2 sales per year is average for the community. While number of transactions was up 150%, the average sale price declined significantly year over year. The 2019 average sale price was $846,950 which is 26% lower than 2018’s average sale price of $1,142,000, but still 14% higher than the last 14 year’s average sale price of $739,890. 2019’s lowest price Corneille Estates sale of $644,200 was 36% lower than 2018’s lowest price sale of $999,000. The highest price paid for a Corneille Estates home in 2019 was $983,000, down 24% from 2018’s high price of $1,285,000, but still 24% higher than the 14-year average high price of $794,654.

DAVIS PARK
Ten sales took place in Davis Park in 2019, which was down from 2018’s record high of 16, but still 67% higher than the average year which sees only 6 sales. The average sale price dipped by 7% from $588,725 in 2018 to $546,980 in 2019, but was still 5% higher than an average year. The highest price paid for a home in Davis Park in 2019 was $999,000 which was an 18% decrease over the previous year, but still 28% higher than the average highest price paid in the last 14 years.

DUNEWOOD
Dunewood had 2 home sales in 2019, which is typical for the community, but down from 3 sales in 2018. The average sale price in 2019 was $1,245,000 which is 26% lower than 2018’s average sale price of $1,678,335, but still 42% higher than the 14-year average of $879,685. The highest price paid for a home in Dunewood in 2019 was $1,550,000 which is 39% higher than the 14-year average high price paid of $1,116,667.

FAIR HARBOR
Fair Harbor had 13 sales in 2019, which is down slightly from 2018’s 14 sales but still 44% higher than the 14-year average of 9 sales per year. The average sale price was down 22% year over year, to $724,869 in 2019 from $926,946 in 2018, but still 6% above the historical average sale price of $682,318. The highest price paid in Fair Harbor in 2019 was $1,300,000, which is 35% lower than the highest price paid in 2018 but still 15% higher than the highest price paid in an average year. The lowest price paid in Fair Harbor in 2019 of $510,000 is 3% lower than the lowest price paid in Fair Harbor in 2018 of $525,000.

FIRE ISLAND PINES
The Pines saw 25 sales in 2019, down from 29 homes sold in 2018. An average year sees 20 Pines homes trade hands. The average sale price declined 15% from $1,008,792 in 2018 to $858,202 in 2019, which is 14% lower than the historical average of $1,002,166. The highest price paid in the Pines in 2019 was $2,200,000, which was tied with a sale in Ocean Bay Park for the most expensive home sale on the island in 2019. This figure is down from $2,485,018 in 2018, and 3% less than the 14-year average high sale price of $2,257,894.

KISMET
Kismet saw market improvement from 2018 to 2019 with 7 home sales in 2019 as compared to 4 in 2018. The historic average for the community is 5 sales per year. The average sale price also increased by 3%, from $671,250 in 2018 to $688,500 in 2019. The lowest price paid for a Kismet home was 81% higher in 2019 than in 2018, and 39% higher than in an average year. The highest price paid in Kismet in 2019 was $900,000 which is a 10% decline from 2018’s high price paid of $995,000.

LONELYVILLE
Lonelyville saw no market activity in 2019, with no homes trading hands. A small community, on average over the last 14 years, only 1 home sells per year. Lonelyville’s 14-year average sale price is $748,198.

OCEAN BAY PARK
Ocean Bay Park saw a dramatic increase in transaction volume, with 19 sales taking place in 2019, as compared to 10 in 2018, and 8 in a typical year. While sale count was way up, the average sale price did decline by 15% from 2018’s record high of $973,745 to $827,907 in 2019. Despite the year over year drop, 2019’s average sale price is still 46% above the average sale price over the last 14 years, which is $565,194. The lowest price paid for an Ocean Bay Park home in 2019 was $500,000, down 9% from 2018’s lowest price paid of $550,000, but still 76% higher than the average lowest price paid over the last 14 years of $283,607. The highest price paid for a home in Ocean Bay Park in 2019 was $2,200,000 which, tied with another $2.2M sale in the Fire Island Pines, was the priciest sale of the year, island-wide, as well as the highest price paid in Ocean Bay Park to date. This is 10% higher than 2018’s high price paid of $2,000,000, (which was the previous record high sale for Ocean Bay Park) and 110% higher than the 14-year average high price paid of $1,046,714.

OCEAN BEACH
Ocean Beach transaction volume was strong in 2019 with 26 homes trading, up 24% from 21 sales in 2018. Over the last 14 years, an average of 21 homes change hands in a given year, making 2019’s sale count 25% greater than is typical. While sale count was up 24% year over year, the average sale price declined by 9%, from $894,230 in 2018 to $809,908 in 2019, which is 18% higher than the historical average sale price of $686,510. The highest price paid in Ocean Beach in 2019 was $1,730,000, which is a record for residential property in Ocean Beach. In 2018, the most expensive property to sell was a $3,800,000 commercial property. The highest price paid for an Ocean Beach residence in 2018 was $1,185,000, representing a 46% year over year increase in the highest price paid for a residence. The lowest price paid for an Ocean Beach home in 2019 was $375,000, down 3% from 2018’s low price of $385,000.

ROBBINS REST
After no home sales in 2018, one home changed hands in Robbins Rest in 2019 which is typical for the small community. 2019’s average sale price was $985,000, up 26% from the historic average sale price of $782,204.

SALTAIRE
Coming off of an extremely weak year in 2018, the Saltaire market improved both in terms of sale count and average sale price. Sale count was up 150% year over year, from 2 sales in 2018 to 5 in 2019. Traditionally considered one of the most desirable communities on Fire Island, Saltaire usually sees 10 homes trade a year with some of the highest price points island wide. The average sale price was up 37% from $775,250 in 2018 to $1,065,000 in 2019.
The lowest price paid for a Saltaire property in 2019 was $500,000, which was 22% lower than the 2018 low price paid of $645,000, and 11% higher than the 14-year average low price. The highest price paid was up 55% from only $905,500 in 2018 to $1,400,000 in 2019, which is 24% below the 14-year average high price paid of $1,838,500.

SEAVIEW
17 homes changed hands in Seaview in 2019, which is a 55% increase over 2018’s 11 sales and 70% more than the 14-year average sale count of 10. Despite the spike in transaction volume, the average sale price declined by 12% from $1,081,591 in 2018 to $947,309 in 2019, which is 9% below the 14-year historical average of $1,037,795.
The lowest price paid in Seaview in 2019 was $531,248 which is 26% less than 2018’s low price of $715,000, and 6% below the historical average low price of $564,196. The highest price paid in Seaview in 2019 was $1,400,000, down 41% from 2018’s high price of $2,372,500. The 14-year average high price paid in Seaview is $1,955,464, which is 28% higher than 2019’s high price paid.

SUMMER CLUB
Sales count doubled in the Summer Club from 2 sales in 2018 to 4 sales in 2019. An average year sees 3 homes change hands in the small community. 2019’s average Summer Club sale price was $849,875, which is a 24% decline from 2018’s average sale price of $1,123,750, but 9% higher than the historical average sale price of $779,219. The lowest price paid in the Summer Club in 2019 was $550,000 as compared to $1,100,000, in 2018, although it should be noted that the 2019 sale was of vacant land. The highest price paid was up by 13% to $1,300,000, which is 31% higher than the 14-year average high price paid of $995,722.

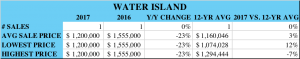
WATER ISLAND
Only one home sold in Water Island in 2019, for a sale price of $1,300,000. 2018 also saw only one home sale in Water Island, at a price point of $1,500,000, representing a 13% year over year decrease, and a 3% premium over the 14-year average sales price of $1,267,042.

CONCLUSION
With both the average and median sale prices reaching record levels in 2018, the Fire Island real estate market saw prices leveling off in 2019. However, the increased number of transactions is indicative of the continued streak of strong performance that we’ve been experiencing since 2016. The market was largely driven by activity in the $750,000 - $1 million price point, which is a departure from 2018’s market dynamics being driven principally by the high end.
Because the Fire Island real estate market does not function like a traditional real estate market with a centralized multiple listing service, reliable market data is not readily available to the public. Our annual market reports are published in an effort to address that. Both buyers and sellers are served by being fully informed about the market in which they are considering transacting. Please do not hesitate to contact me at abigail@fireislandrealestate.com if I can provide any further information, or if I can be of help to you in the sale or purchase of your Fire Island home.
METHODOLOGY
Please note that all information herein is deemed reliable but not guaranteed. The information is sourced from public real estate transaction records. Sales data reporting has a lag of approximately 90 days. Due to this lag, there may be some outstanding sales that closed late in 2019 but have not yet been reported and are therefore not reflected in this report. All historic data refers to the period between 2006 and 2019.
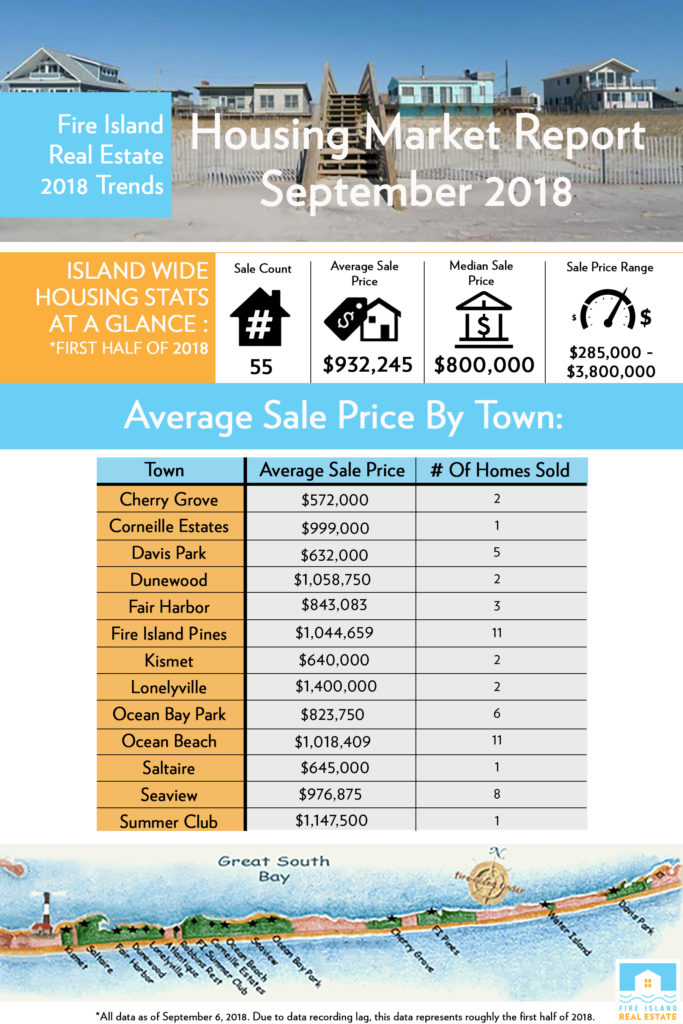
Fire Island Real Estate has gathered data on the Fire Island housing market so far in 2018. Check out our infographic below for Fire Island wide housing stats.
abigail@fireislandrealestate.com
So far, things have been looking up for the Fire Island real estate market in 2018. There have been 30 sales transactions recorded island wide, year to date. Because there is a recording lag of up to 90 days for sale data to come through to public sale record, this data consists mainly of sales that closed during the first quarter of 2018. At 30 transactions closed year to date, that puts transaction volume on pace for approximately 120 sales this year. In an average year, Fire Island sees 99 homes sell, indicating that the strong market we've been experiencing over the past few years appears to be continuing into 2018.
The average Fire Island year to date sale price is $925,853, which is up 16% from 2017's average sale price of $797,947. The median sale price is $804,250, which is up 6% from 2017's median price of $760,000. The high end of the market has been performing much better in 2018 than it did in 2017. While the overall market was strong in 2017, the high end of the market was unusually inactive, with no homes trading over the $2 million mark. 2018 is already ahead of last year, with the highest price paid for a home so far coming in at $2,390,000, which is nearly 30% higher than 2017's high price paid of $1,850,000.
Curious as to how the market is performing in your town? See the table below for a town by town breakdown of the year to date 2018 average sale price as compared to 2017.


Prepared By: Abigail Medvin Mago, Licensed Associate Broker
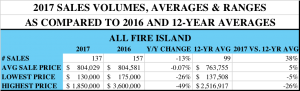
Overall the Fire Island real estate market saw another strong year in 2017. A typical year sees 99 transactions per year[1], but in 2017, 137 Fire Island homes were sold. While that does represent a 13% year over year decline from 2016’s very brisk volume of 157 sales, when put into historical context, 2017 transaction volume was 38% greater than an average year. Additionally, we may see a few more 2017 sales come through recording, which should bring the year over year sales volume numbers closer to parity.
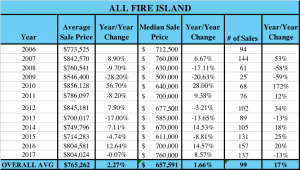
The average sale price stayed essentially flat year over year, from $804,581 in 2016 to $804,024 in 2017. To put the average sale price in historical context, the 2017 island-wide average sale price of $804,029 is 5% above the 12-year average of $763,755. (I began collecting data in 2006, so all historic averages refer to 2006 through 2017.)
The highest price paid for a home on the island in 2017 was $1,850,000, which is nearly 50% lower than the highest price paid for a Fire Island home in 2016, which was $3,600,000. It is also 26% lower than the 12-year average of the highest price paid in a given year since 2006, which is $2,516,917. The only year since I began collecting data where the highest price paid for a home in that year was lower than 2017 was in 2009, where the highest price paid topped out at $1,200,000. The lack of activity at the very top end of the market is somewhat unusual, however does not seem to be symptomatic of performance in the rest of the market.
Because of the relatively small size of the Fire Island market, when we see transactions in the 2 and 3 million dollar range, it can skew the overall averages upward fairly significantly, so the fact that the average sale price remained essentially the same year over year even though there were no high value sales (defined as $2 million and over) shows that price performance in 2017 was actually stronger than the average sale price would indicate. In fact, when we look at the median sale prices, 2017 outperformed 2016 by 8%, with a median sale price of $760,000 as compared to 2016’s median price of $700,000. Although the very high-end of the market saw little activity, this indicates strong market performance in the middle and lower segments of the market. Because the median is not skewed by outliers as the average is, it can be a more accurate measure of market performance. The 2017 median sale price of $760,000 is (tied with 2007) the highest median sale price seen during the data collection period. Evidence of this trend is also seen in the fact that several communities saw a drastic rise in price point for the lowest price sale of the year, indicating that inventory at the lowest segment of the market has largely cleared.
To put the 2017 market data into perspective, it is helpful to look at sales figures relative to the entire period of data collection in addition to comparing to the previous year’s performance.
Town by Town Analysis
In addition to looking at the island’s overall market performance, it is useful to examine the data on a town by town basis.
ATLANTIQUE
Atlantique saw no sales activity in 2017. A small community, Atlantique usually sees 1 sale per year. The average sale price over the past 12 years in Atlantique is $589,323.

CHERRY GROVE
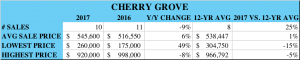
Cherry Grove had another solid year in 2017, with 10 homes trading, as compared to 11 homes in 2016 and a historical average of 8 per year. The average sale price in 2017 was $545,600, which was up 6% from $516,550 in 2016, and up 1% from the 12-year average sale price of $538,447. The least expensive Cherry Grove property to trade in 2017 was $260,000, up 49% from 2016’s lowest price of $175,000.
CORNEILLE ESTATES
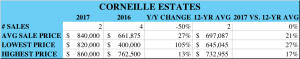
Two homes sold in Corneille Estates in 2017, as compared to 4 homes in 2016. Even though the number of sales declined by 50% year over year, 2 sales per year is average for the community. The 2017 average sale price was $840,000 which is 27% higher than 2016’s average sale price and 21% higher than the last 12 year’s average sale price of $697,087. 2017’s lowest price Corneille Estates sale of $820,000 was more than double 2016’s lowest price sale of $400,000. The highest price paid for a Corneille Estates home in 2017 was $860,000, up 13% from 2016’s high price of $762,500 and up 17% from the 12-year average high price of $732,955.
DAVIS PARK
Sales transaction volume in Davis Park doubled in 2017, going from four sales in 2016 to 8 sales in 2017. The average sale price rose by 10% from $521,250 in 2016 to $571,529 in 2017, and was 12% higher than an average year. The highest price paid for a home in Davis Park in 2017 was $875,000 which was a 37% increase over the previous year, and 21% higher than the average highest price paid in the last 12 years.

DUNEWOOD
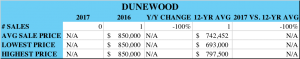
No homes sold in Dunewood in 2017. A small community, Dunewood typically sees only one home sale per year. In the last 12 years, the average sale price in Dunewood was $742,452.
FAIR HARBOR
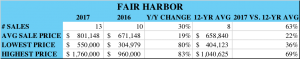
Fair Harbor had a very strong year with 13 sales in 2017, representing a 30% year over year increase in sales volume and a 63% increase over the 12-year average of 8 sales per year. The average sale price was also up 19% year over year, to $801,148 in 2017 from $671,148 in 2016. This is a 22% increase over the historical average sale price of $658,840. The highest price paid in Fair Harbor in 2017 was $1,760,000, which is 83% higher than the highest price paid in 2016 and 69% higher than the highest price paid in an average year. The lowest price paid in Fair Harbor in 2017 of $550,000 is 80% higher than the lowest price paid in Fair Harbor in 2016 of $304,979.
FIRE ISLAND PINES
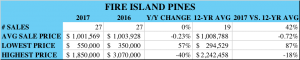
The Pines market remained remarkably steady from 2016 to 2017, with 27 homes trading hands in both years and the average sale price remaining with a quarter percentage point, year over year. The average 2017 sale price was $1,001,569, which is less than 1% shy of the 12-year average sale price of $1,008,788. Like the similarly priced communities of Seaview and Saltaire, the Pines saw a similar trend in the highest price paid for the year being much less than the 12-year historical average. The highest price paid in the Pines in 2017 was $1,850,000, down 40% from 2016’s high price of $3,070,000 and off 18% from the 12-year average sale price of $2,242,458. The lowest price paid in the Pines in 2017 was $550,000, which is 57% higher than the lowest price paid in 2016 of $350,000.
Interestingly, we see the exact same data pattern as Seaview and Saltaire, when looking at the median price points. Even though the average sale prices saw almost no change, the median sale price increased by 9.5% from $840,000 in 2016 to $920,000 in 2017. This in combination with the lack of high end sales, indicate the market was driven by strength in the middle segment, whereas 2016’s market performance was buoyed by a handful of high priced sales.
KISMET
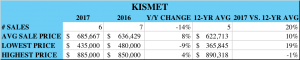
Kismet saw solid price growth, with an 8% year over year increase in average sale price. While the number of sales declined from 7 in 2016 to 6 sales in 2017, that still represents a sales volume of 20% greater than an average year. The average sale price increased from $636,429 in 2016 to $685,667 in 2017. The lowest price paid for a Kismet home was 9% lower in 2017 than in 2016, but was 19% higher than in an average year. The highest price paid in Kismet in 2017 was $885,000 which was 4% higher than 2016’s high price paid of $850,000.
OCEAN BAY PARK
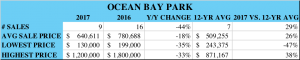
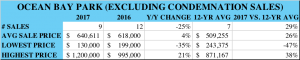
2017 saw 9 home sales in Ocean Bay Park at an average sale price of $640,611. In comparison, 2016 saw 16 Ocean Bay Park home sales at an average sale price of $780,688. However, comparing these measures year over year is misleading, due to the fact that several condemnation sales of oceanfront homes took place in 2016 in order to facilitate the dune restoration project that will be completed this year. Owners of the condemned oceanfront properties were paid market value for their homes by the county, resulting in an upward skewing of the 2016 sales data since the proportion of oceanfront homes (which naturally command a large premium relative to inland properties) sold in 2016 was so much greater than in a typical year. 2017’s average sale price was down 18% from 2016’s average sale price of $780,688, but when the oceanfront condemnation sales are excluded, 2016’s average sale price was actually only $618,000, indicating that the year over year average sale price actually increased by 4%, and was 26% higher than the 12-year average Ocean Bay Park sale price of $509,255. Ocean Bay Park continues to gain desirability as former share houses are being bought up and converted into luxury family homes or high-end rentals.
OCEAN BEACH
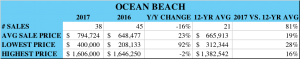
The lion’s share of the island’s 137 sales took place in Ocean Beach, with 38 homes changing hands in 2017. That represents a 16% decline from Ocean Beach transaction volume in 2016 which was extraordinarily high at 45 homes. Since 2006, the village has seen 21 homes sell per year on average, so even though year over year volume was down, 2017 saw 81% more Ocean Beach home sales than a typical year.
As one might expect in light of the continued strong pace of sales, Ocean Beach sale prices were also up in 2017. The average Ocean Beach sale price in 2017 was $794,724 which is a 23% increase over the 2016 average sale price of $648,477 and 19% above the 12-year average Ocean Beach sale price, which is $665,913. The highest price paid for a home in Ocean Beach in 2017 was $1,606,000, which is 2% less than 2016’s high price of $1,646,250. The lowest price paid for an Ocean Beach home in 2017 was $400,000, up 92% from 2016’s low price of $208,133.
ROBBINS REST
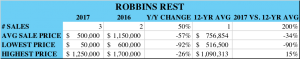
Three homes sold in Robbins Rest in 2017, as compared to 2 sales in 2016. A typical year sees only one home trade in this small community, so 3 sales is a high volume year. While the volume of transactions increased, the average sale price was down considerably from $1,150,000 in 2016 to only $500,000 in 2017. This represents a 57% year over year decline in average sale price and a 34% decline from the 12-year average sale price of $756,854, however two of the three sales were of vacant parcels, thus explaining the lower price point.
SALTAIRE
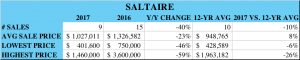
Saltaire had a surprisingly lackluster year in 2017. Sales volume was down 40% from 15 sales in 2016 to only 9 sales in 2017. While the year over year transaction volume decline was steep, when compared to the 12-year average volume of 10 sales per year, 9 sales per year is not atypical. The average sale price was also down year over year, from $1,326,582 in 2016 to $1,027,011, however the 2017 average sale price was still 8% higher than the 12-year average. Interestingly, the highest price paid in Saltaire in 2017 was $1,460,000, nearly 60% less than 2016’s highest price paid of $3,600,0000. In a typical year, the highest price paid in Saltaire is $1,963,182, which is 26% higher than 2017’s highest sale. The lack of high end sales mimics the data observed in Seaview, and the Fire Island Pines which typically trade at a similar price point to Saltaire. When looking at the median price point data, we still see a price decline, but a much smaller one. The median sale price in Saltaire in 2016 was $1,075,000, as compared to $1,020,000 in 2017, a decline of just half a percent.
SEAVIEW
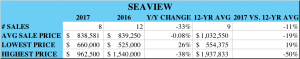
Seaview is traditionally considered one of the most desirable communities on Fire Island, but the past two years have seen a significant slump in sales. Only 8 Seaview homes traded hands in 2017, as compared to 12 in 2016 which represents a 33% decline in year over year sales transaction volume. However, when comparing to the past 12-year average of 9 sales per year, 8 Seaview home sales in a given year is not atypical.
The average sale price was nearly flat, year over year. The average 2017 sale price was $838,581, as compared to 2016’s average of $839,250, both off 19% from Seaview’s 12-year average sale price of $1,032,550. The most expensive home sale in Seaview in 2017 was $962,500 which is less than half the price of the most expensive home sold in an average year, which is typically close to the $2 million mark. It is rare to see a year where nothing in Seaview trades above the $2 million mark, let alone the $1 million mark. The lowest price Seaview home sold in 2017 was $660,00, which was 26% higher than 2016’s lowest price Seaview sale of $525,000. While the average sale price declined by less than 1%, the median sale price increased by 15% from $750,000 in 2016 to $863,000 in 2017.
It’s unclear why the Seaview market has been underperforming for the past couple of years. Given the small data set, I am inclined to think the lackluster sales figures don’t truly reflect a real drop in value but are driven by the fact that none of Seaview’s high value homes happened to have traded in the past 2 years. Due to its convenient location between Ocean Beach and Ocean Bay Park and considerable community amenities, Seaview remains in high demand among buyers, but quality inventory has been limited. We’ll see if 2018 sees a return to typical price levels in the community.
SUMMER CLUB
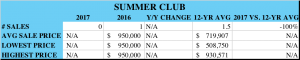
No homes traded in the Summer Club in 2017. Given that the community is comprised of only 40 homes, that’s not terribly surprising, but a typical year does see 1.5 homes in the community trade. The 12-year average sale price in the Summer Club is $719,907. With several high-end homes currently for sale in the Summer Club, I believe 2018 will see at least a few trades in the Summer Club, likely at significantly higher price levels.
WATER ISLAND
Only one home sold in Water Island in 2017, for a sale price of $1,200,000. 2016 also saw only one home sale in Water Island, but at a higher price point of $1,55,000. While the year over year average price was 23% lower in 2017, it’s still 3% above the 12-year average sale price of $1,160,046.
Conclusion
The strong Fire Island real estate market performance observed in 2016 continued into 2017, however was driven mainly by the middle and lower segments of the market. The top segment of the market (defined as $2 million and up) was completely dormant in 2017, while a typical year sees at least a handful of transactions upwards of the $2 and $3 million dollar price points. Despite this lack of activity at the high end, median sale prices were up and average sale prices remained stable, year over year. Cherry Grove, Corneille Estates, Fair Harbor, Fire Island Pines, Ocean Beach, and Seaview all saw drastic increases in their lowest price sale, year over year, indicating that inventory at the bottom end of the market has cleared.
Because the Fire Island real estate market does not function like a traditional real estate market with a centralized multiple listing service, reliable market data is not readily available to the public. Our annual market reports are published in an effort to address that. Both buyers and sellers are served by being fully informed about the market in which they are considering transacting. Please do not hesitate to contact me at abigail@fireislandrealestate.com if I can provide any further information, or if I can be of help to you in the sale or purchase of your Fire Island home.
Methodology
Please note that all information herein is deemed reliable but not guaranteed. The information is sourced from public real estate transaction records. Sales data reporting has a lag of approximately 90 days. Due to this lag, there may be some outstanding sales that closed late in 2017 but have not yet been reported and are therefore not reflected in this report.
[1] From 2006 – 2017, the average number of transactions per year has been 99.
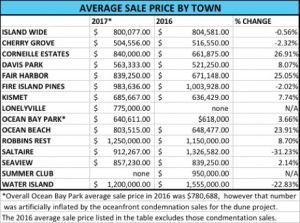
2017 was another strong year in the Fire Island real estate market. The island wide average recorded sale price as of December 22nd was $800,077, which is nearly even with 2016’s average sale price of $804,581. Several Fire Island towns saw huge year over year price growth, including Ocean Beach, where prices increased 24%, Corneille Estates, which saw a year over year increase of 27%, and Fair Harbor which saw a 25% increase in average sale price. Ocean Bay Park and Seaview saw more modest price growth at 4% and 2%, respectively. See the table below for average sale prices by town. Please note that there is a data recording lag of up to 90 days, so not all 2017 transactions have been recorded yet. The figures below represent all reported data as of December 22, 2017. We will issue a comprehensive market report in the first quarter of 2018 that will have complete 2017 sales data.
The Fire Island real estate market is still going strong. Our firm is on pace for another record year in 2017 and we want to thank all of our wonderful clients! We believe in the importance of a data driven approach and we know reliable market data can be hard to come by on Fire Island. Our annual Market Report will come out after year end, but in the meantime, we wanted to provide you with some year to date average sale data to tide you over.
Below are average recorded sale prices so far this year, by community:
Ocean Beach $770,130
Seaview $915,000
Ocean Bay Park $622,438
Robbins Rest $1,250,000
Corneille Estates $840,000
Lonelyville $775,000
Kismet $708,800
Cherry Grove $479,000
Davis Park $705,000
Fair Harbor $743,750
Fire Island Pines $877,143
Saltaire $897,657
Water Island $1,200,000
Please note that there is a lag between the time when sales actually close, are recorded in public records, and then become available to us through our data service, so there may be some closed sales not yet factored in to the above statistics.